Your B2B marketing 2020 efforts must align with what the audience wants and needs. Keeping that in mind makes it easier to make content marketing creation plans that have a high likelihood of paying off.
To help guide your B2B content marketing strategy, let’s take a look a closer look at the 2020 State of B2B Content Consumption and Demand report, published by NetLine Corporation.
Here are eight B2B content marketing statistics from that report worth knowing.
11.42% of C-Suite Executives Open Content at 10 a.m
“What is the best time to email content to C-Suite executives?” is a common question. As it turns out, 10 o’clock a.m. is the sweet spot for timing if your goal is to get in touch with C-Suite executives. More specifically, researchers found that 11.42% of people in that segment opened the material at 10 a.m.
The percentage is small, but that also means you have the flexibility to send the content out at a different time if that works better. For example, noon was the next best time, with 11.12% of people reading the content then — possibly while starting their lunch breaks.
Remember that your target audience could behave differently from the norm, so the best way forward may not be to stick to the timing mentioned here. Consider offering the material at a set time for a defined period, then track open-rate metrics over that period to see what kind of response you get.
11.42% of C-Suite executives open content at 10 a.m #email #B2B
Click To Tweet
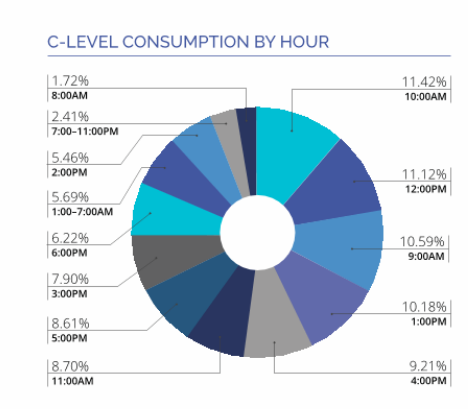
C-Level content consumption by hour. Source: All images from NetLine Corporation study linked above.
Executives and Leaders in Most Job Categories Took 8% Longer to Open Requested Content Than Others
The consumption gap represents the time between someone requesting the content from a company and their opening it. The main takeaway is that people don’t typically ask for content at the precise moment when they’re ready to read it.
Outside of people in contracting and consulting roles, most people in executive and leadership positions took 8% longer than individuals in other categories to start looking at their B2B content after asking for it. The report’s creators recommend that you don’t solely focus on people in the C-suite.
They may be the ones who ultimately give the go-ahead for purchasing your products. Still, other people in lower-level positions may open your content faster, thereby starting their educational journey before their superiors do. There’s no harm in tailoring some content to the C-suite, but don’t make them your only targeted group. People in other positions appreciate high-quality content too, and they may influence those higher up the company.
Executives and leaders in take 8% longer to open requested content than others. #B2B #content
Click To Tweet
B2B Content Consumers Access Material From Desktop Devices 68.1% of the Time
Statistics gathered for reasons not related to this report show that people are more likely to access the internet from their mobile phones than from desktop computers. The B2B audiences studied here don’t follow that trend, however.
The breakdown showed that 68.1% of people look at B2B content on computers. Then, 28.7% of the total used their phones to engage with it, and 3.2% of the pool accessed the material from tablets. The report did say, though, that the percentage of people on mobile phones grew by 10% between 2018 and 2019.
B2B content consumers access material from desktop devices 68.1% of the time. #B2B #content
Click To Tweet
Another thing to keep in mind is that the report’s authors believe the percentage of people viewing B2B content on mobile devices will go up as more Generation Z members enter the workforce. They’re more likely to have more capable, ultra-modern smartphones to keep pace with the increasingly mobile world. Marketers should still accommodate the smaller screen sizes and make smart decisions to keep the content mobile-friendly.
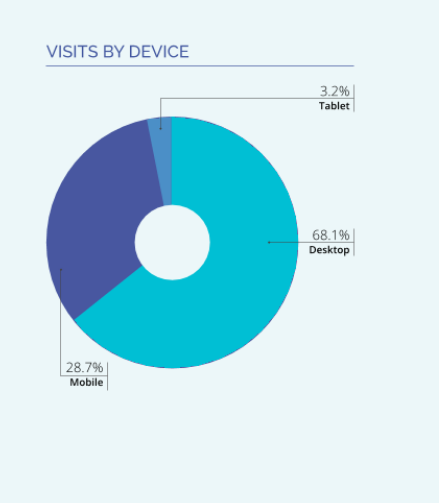
Consumption of B2B content by device
27% of the Active Audience for B2B Content Came From Organizations With Fewer Than 25 Employees
NetLine defines its active audience as people who requested B2B content. The data showed that 27% of the people who actively consumed B2B content worked at organizations with 1-24 employees. That statistic remained flat compared to last year’s report.
It may also come as a surprise that companies with 1-4 workers accounted for 15.62% of the 27%, segment making them the largest individual group in that percentage. If smaller companies are one of your targets, these findings strongly suggest that you should keep smaller companies in mind while creating your content. Think about the needs they likely have and how your brand could meet them.
Network Security Experts Are 87% More Likely to Enjoy DIY Projects Outside the Office Than Other Professionals
The report also discusses affinity categories. The goal is to remember that your readers are real people who have diverse sets of interests spanning outside your company or products.
One of the related B2B content statistics was that network security professionals are 87% more likely to engage in do-it-yourself projects outside the office than other professionals. That may mean you offer content that introduces them to tech projects they could do at home and ties into your company somehow.
The buyer affinities chart includes a wide variety of subtopics, though. That diversity indicates you should not shy away from creating interesting material that covers some other topics and themes not strictly related to your company. You may find that this approach leads to more repeat site visits because people are eager to see what you’ll publish next.
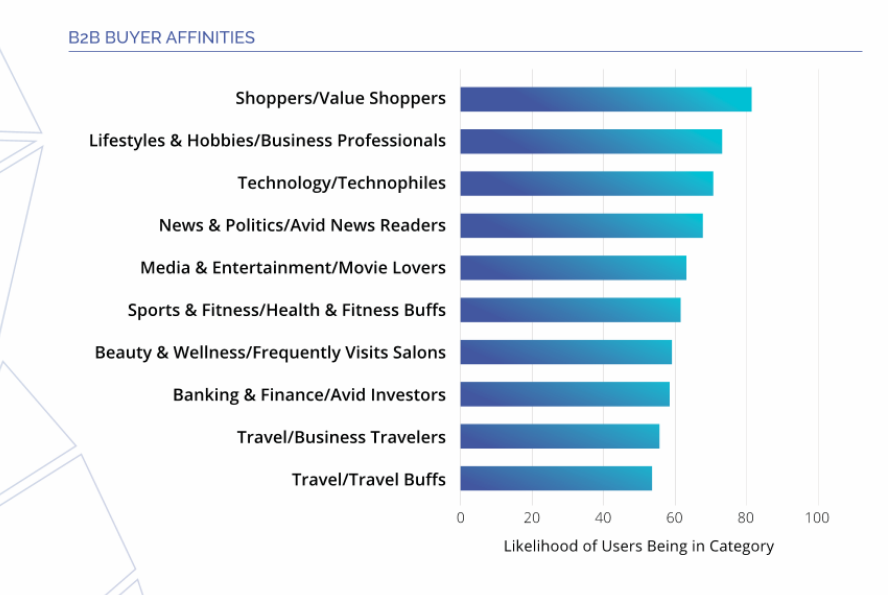
B2B buyer affinities
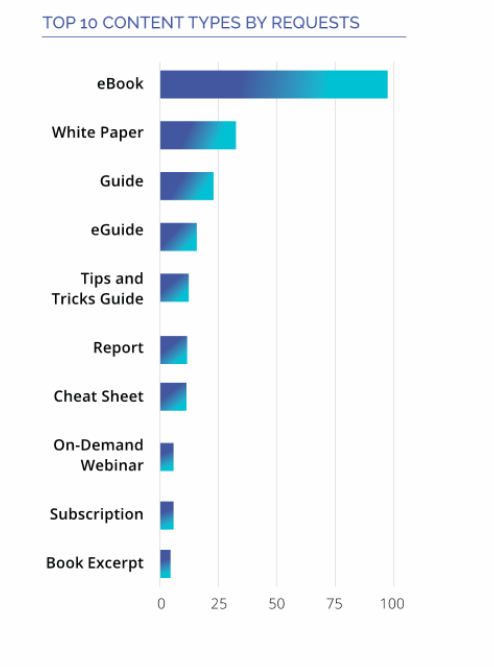
E-Books, White Papers and Guides Comprise Roughly 56% of Inventory in the Market
If you’re wondering what kind of content to create as part of your B2B marketing 2020 plans, e-books, white papers and guides are good options to go with first. Statistics show that approximately 56% of all the inventory in the market is one of these kinds.
Concerning the kind of content requested, people wanted e-books most often, followed by white papers and guides. NetLine’s analysts point out that e-books are exceptionally versatile. You could use them to feature case studies, show thought leadership or call attention to any other factors that could drive sales.
Notice, too, the educational nature of those top three content types. Your B2B audience is ready to learn, and you can help them do that with high-quality material that caters to their needs. In any case, ensure that your content marketing strategy serves a defined purpose and is goal-driven.
More Than 30% of Demand for B2B Content Comes From the Information Technology Sector
More than 30% of the overall content demand comes from audiences in that sector. That change represents a 3% rise from 2018 numbers.
IT professionals took the top spot for audience demand, but other sectors wanted content, too. For example, audiences in the accounting and finance industries collectively gained half a percentage point in the desire for relevant material, showing the biggest growth across all job areas.
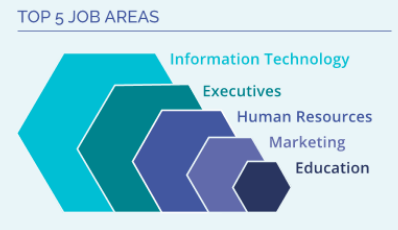
Effective ways also exist to capitalize on the B2B marketing statistics here if IT is not your main focus. For example, if your company sells a product geared towards several industries — information technology among them — consider creating a newsletter or online content hub for tech professionals.
The High-Tech IT Industry Has the Most Active Audience
You learned earlier that IT professionals make up nearly one-third of the total content demand. A related fact is that the high-tech IT industry showed the most active audience. This means people in that group were the most likely to request and engage with the material.
The report’s authors noted that people working at high-tech IT companies must stay educated on the latest developments. New content could make it easier for them to do that.
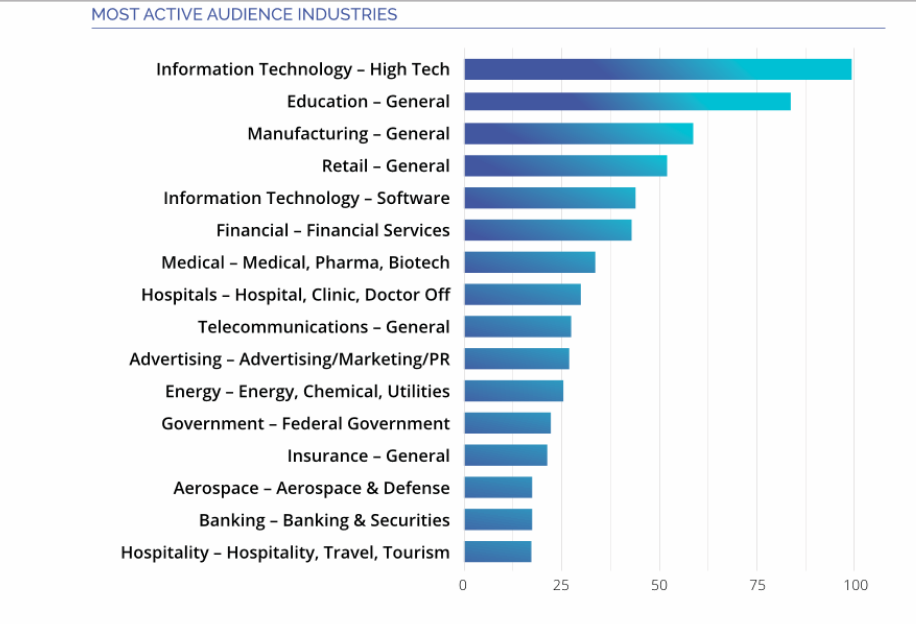
Most active industries for content consumption
Consider how you might create or adapt content to make it maximally appealing to people working with advanced tech. You might gather expert perspectives about the future of a broad but relevant topic, such as cloud computing or automation, to help readers learn what’s on the horizon.
 Grab Your Free Copy of the Report Now
Note from our editor: If you haven’t already, please grab your own copy of the 2020 State of B2B Content Consumption and Demand report from our friends at NetLine Corporation. Tons of useful data to guide your strategy in 2020!
The post 2020 B2B Content Marketing Statistics: Charts and Data appeared first on Content Marketing Consulting and Social Media Strategy.
from Content Marketing Consulting and Social Media Strategy https://ift.tt/3eyp8ZC

No comments:
Post a Comment